The short version
- Most analytics products hand you a fixed dashboard and a date picker. Strive's reports are the opposite.
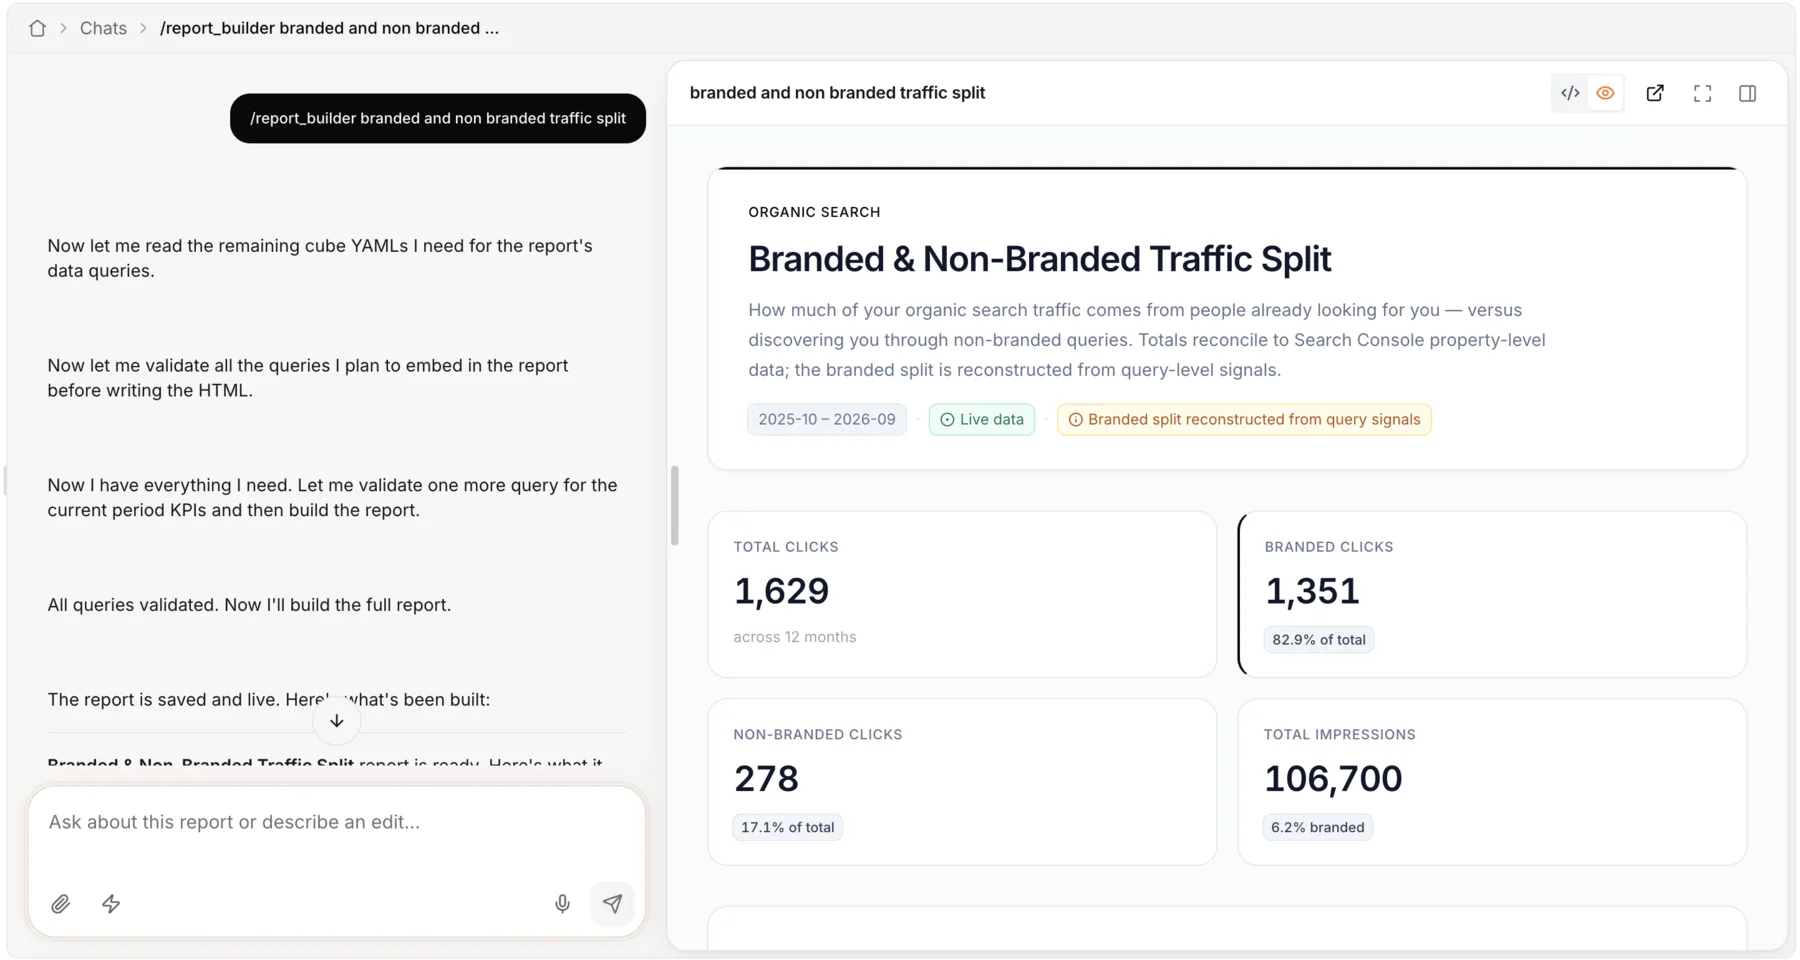
- An agent writes the report itself — a complete HTML document with its own layout, its own charts, its own SQL.
- That document then fetches live data from the tenant's warehouse every time someone opens it. Not a snapshot. Not a template with slots. Actual generated software.
The conversation is the builder
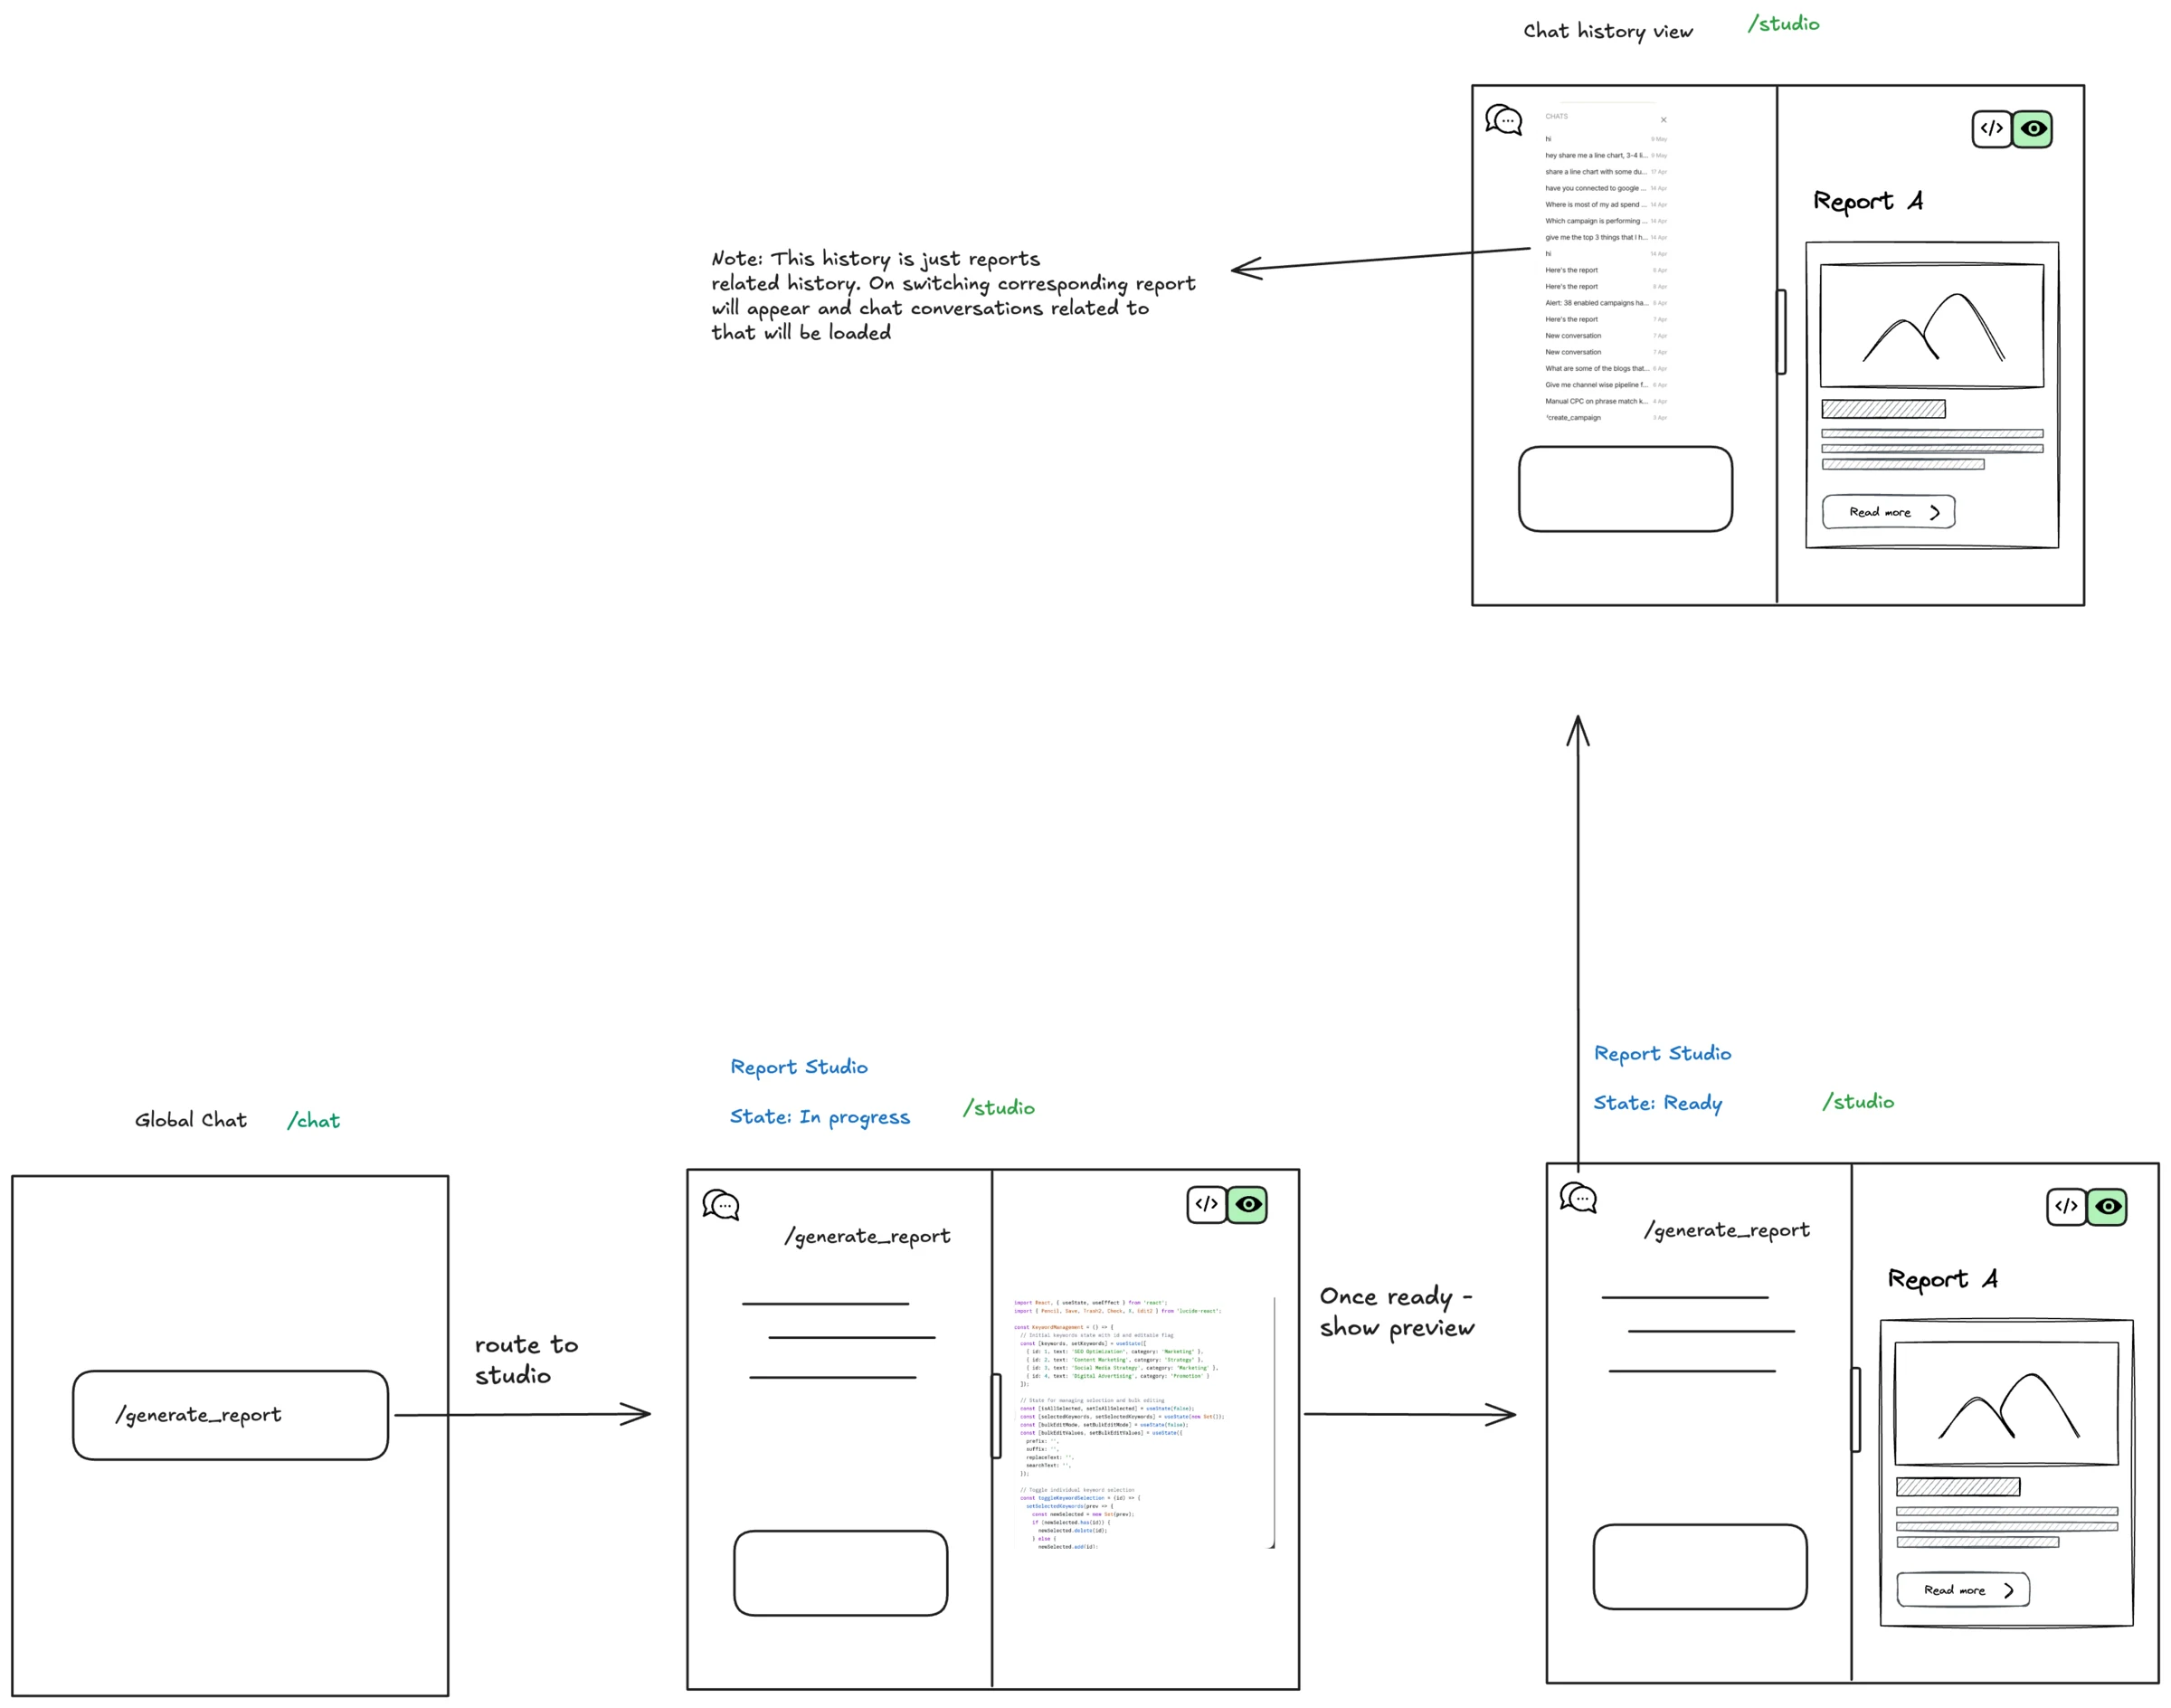
- You describe the report in chat. It materialises in a canvas beside the conversation.
- Say "make the CPL card a trend line instead" — the agent rewrites the file while you watch.
- No separate report studio. No builder UI to learn. Nothing to drag.
- It renders in the tenant's own brand — colours, fonts, radii pulled from their actual website — so the report looks like their team made it, not ours.
The hard parts
Running code you didn't write
- Reports execute arbitrary agent-authored JavaScript, so they load in an
allow-scripts-only iframe: an opaque origin that can't reach parent cookies, storage or DOM. - Everything the report needs crosses a narrow
postMessagebridge — data requests in, results out, nothing else. - The host stays the only thing holding credentials. The sandbox just asks.
SANDBOX agent-written HTML ─▶ asks over postMessage
HOST TanStack Query ─▶ Cube ─▶ BigQuery
BACK results ─▶ through the bridge ─▶ charts render
Brand theming, automatically
- A design system is extracted from the customer's domain during onboarding, then handed to the agent as generation context.
- Every report inherits it by default — no per-report styling, no brand review queue.
PDF export
- The sandbox self-snapshots its own DOM, a headless-Chromium Lambda renders it, and the result lands as a signed S3 URL.
- Making that paginate cleanly across multi-page reports is a story of its own.
Under the hood
- Core
- React 19, TypeScript, Vite, Tailwind
- State
- TanStack Query (cache invalidation drives the live refresh), Zustand
- Isolation
allow-scripts-only iframe, opaque-origin postMessage protocol- Report runtime
- Agent-authored HTML — Tailwind CDN + Chart.js inside the sandbox
- Data
- BigQuery + Cube semantic layer, brokered through the bridge
- Export
- DOM self-snapshot → headless-Chromium Lambda → S3 signed URL
- Native reports
- Block renderers, Recharts, TanStack Table
- Platform
- Clerk auth, PostHog analytics, Vitest + Playwright
Why it matters
Reports are where the platform's work becomes visible. Agents run, data lands in the warehouse, and this is the surface where a marketer actually sees it — branded like their own product, live rather than stale, and one click from a conversation about what to do next.
A dashboard shows you the numbers someone else chose. This writes the report you asked for.